Many months ago, while analyzing a large dataset I had gathered for my master’s thesis, I realized that my department’s SPSS license had expired. After panicking for a bit and doomscrolling instead of being productive, I came across a mention of the Analysis ToolPak. It turns out this add-in is a fully featured statistical toolkit bundled with Excel, even though I’d never noticed it before.
Activating it turned out to be quite easy, too. All I had to do was go to File -> Options -> Add-ins, scroll down to Inactive Application Add-ins, select Analysis ToolPak, and click Go. From that moment on, it appeared under Data -> Analysis -> Data Analysis, ready to use whenever I needed it. Since activating it that day, I’ve been able to rely on it for everything below without any issues.
This Excel feature helps me make better decisions (and avoid regrets)
Who needs a crystal ball when you’ve got What-If Analysis?
Basic descriptive statistics
The fastest way to get to know your data

The first step in almost any analysis involves understanding what your data actually looks like: its spread, center, and overall shape. In SPSS, you would typically run Frequencies or Descriptives to get this overview. However, you’d be running Excel’s Descriptive Statistics if you’re using the Analysis ToolPak. Then, you’d select your data range, and Excel will generate a table showing the mean, median, standard deviation, standard error, and several other useful measures.
In my master’s research on an Extensive Reading (ER) program, I analyzed survey data and ran descriptive statistics for Time Taken to Complete (in seconds) and Completion Rate (%). The output showed a mean completion time of 615.92 seconds and a standard deviation of 145.54, indicating that most students finished within a roughly 10-minute window.
I obtained that result without navigating through multiple SPSS menus, and the output appeared directly in the same spreadsheet that already contained my dataset, making it much easier to review and cross-check values.
The Analysis ToolPak handles data selection in a slightly old-school way because it requires a contiguous reference, meaning there cannot be skipped columns or empty rows in the middle of your dataset. For example, if you need to analyze columns A and C, you would first have to move them next to each other before running the analysis.
Basic inferential statistics
Testing to see if your numbers back you up
Once you understand what your data looks like, the next question is usually whether the differences you see mean anything. The Analysis ToolPak handles the most common inferential tests — paired and two-sample t-tests, z-tests, and ANOVA — without requiring complicated setup.
For my ER data, I wanted to determine whether gender influenced survey completion time. Because of the contiguous-data requirement, I couldn’t simply point Excel at a completion-time column and a gender column at the same time. Instead, I used Excel’s FILTER function to create two formulas to split the completion times by gender into separate columns, with the first column holding male responses and the second holding female responses:
=FILTER(F6:F149, T6:T149=2)
=FILTER(F6:F149, T6:T149=1)
After separating the data, I ran a t-Test: Two-Sample Assuming Unequal Variances, using the male completion time column as the Variable 1 Range and the female completion time column as the Variable 2 Range. The output showed no meaningful difference between males (M = 1531.00s) and females (M = 1446.64s), with t = 0.46 and p = 0.65, indicating that gender was not a factor.
I applied the same logic using a Single-Factor ANOVA to test whether the reading device — mobile, tablet, or computer — affected enjoyment ratings. After filtering the enjoyment scores into three adjacent columns, one for each device group, I selected them together and ran the analysis. The resulting F-statistic and p-value (p > 0.05) indicated that the device had no significant effect on the number of students who enjoyed reading.
Regression analysis
Finding relationships in your data
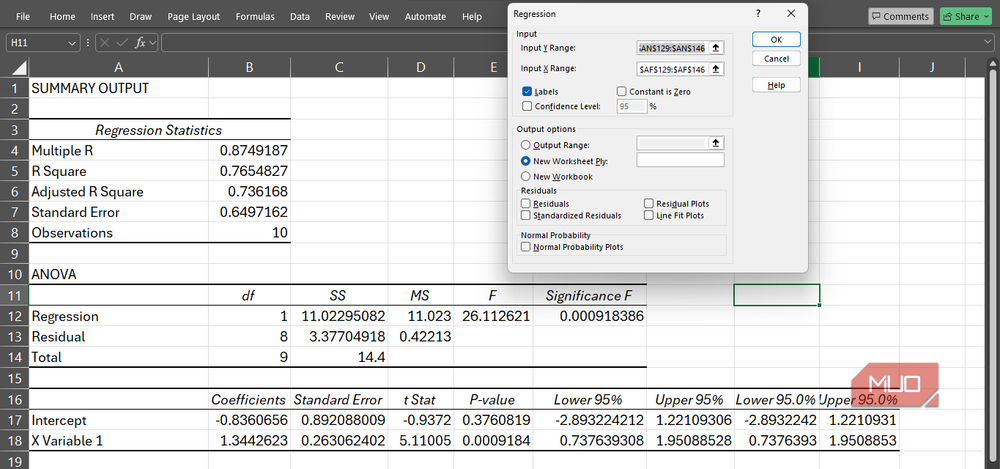
If descriptives and t-tests are the bread and butter of data analysis, regression is the jam. The Analysis ToolPak’s Regression tool relies on the least squares method, the same approach used in SPSS’s Regression menu, and it outputs the full suite of results, including R-squared values, coefficients, standard errors, and p-values.
For my ER research, I wanted to see whether the ease with which students found the reading material could predict how much they enjoyed it. I set my Y range to enjoyment scores and my X range to ease-of-reading ratings, making sure that neither range contained empty cells and that both had matching row counts. The results were quite exciting: ease of reading explained 76% of the variance in enjoyment (R² = .765), and for every one-unit increase in ease, enjoyment scores rose by 1.34 points (p
Spotting the trend over time
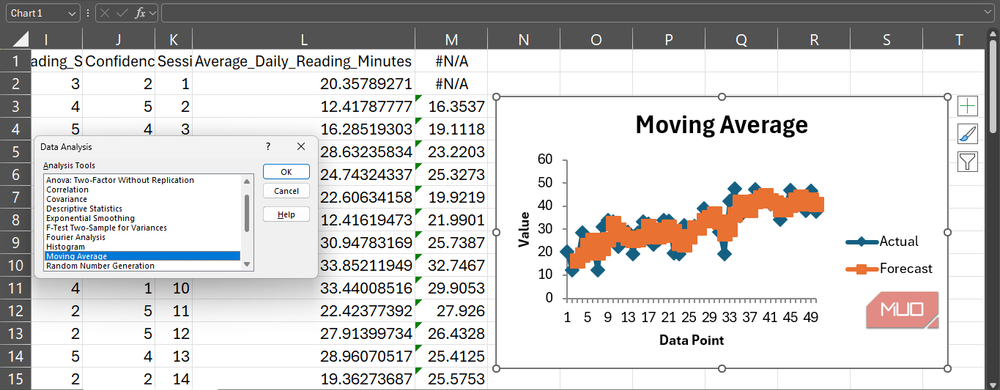
Beyond the typical Statistics 101 toolkit, the Analysis ToolPak also includes more specialized tools, such as Fourier Analysis, Exponential Smoothing, and Moving Averages, which are particularly useful for identifying patterns that develop over time. While these tools often appear in engineering or technical contexts, they can also be useful when you’re working with longitudinal program data.
For example, I used the Moving Average tool on average daily reading minutes collected across sessions, setting the interval to three. Excel produced a rolling average chart that showed a steady upward trend in student reading stamina. Even though the data included occasional dips, the trend line revealed that stamina consistently increased as the ER program progressed.
You probably already have the tool you need
The Analysis ToolPak will not replace SPSS in every situation. If you’re running multilevel models or structural equation modeling, you’ll still need heavier statistical machinery designed for those specialized tasks.
However, for the survey-based, parametric, hypothesis-testing work that makes up the bulk of most research projects, Excel already has you covered. In many cases, the tool you need isn’t something you have to download or pay for; it’s already in Excel, waiting to be turned on.
- OS
-
Windows, macOS
- Supported Desktop Browsers
-
All via web app
- Developer(s)
-
Microsoft
- Free trial
-
One month
- Price model
-
Subscription
- iOS compatible
-
Yes
Microsoft Excel is a powerful spreadsheet application used for data organization, analysis, and visualization. It supports formulas, functions, pivot tables, and charts to process complex datasets efficiently. Widely used in business and education, Excel also integrates with other Microsoft 365 apps for collaboration, automation, and real-time data insights.

